
Household essentials price trends in 2026 are mixed: headline inflation is cooling on paper, but the prices you actually feel at checkout are jumpier. The BLS Consumer Price Index showed all-items inflation moderately elevated over 12 months in August 2026, while Numerator's Consumer Goods Price Index put consumer-paid prices up 2.2% year over year. The fastest fix: check unit prices, not sticker prices, before you buy.
TL;DR:
- Consumer-paid prices are rising more slowly, but regional supply shocks and category-specific swings still cause noticeable price volatility at checkout.
- Household expenses for energy and building materials remain unpredictable due to ongoing supply-chain disruptions and input cost fluctuations.
- Tracking unit prices of frequently purchased items provides a clearer savings signal than relying solely on broad inflation indices.
- Seasonality significantly influences prices, with timing purchases around known low-demand periods to reduce costs.
- Policy impacts, such as tariffs and freight costs, take weeks to affect prices and vary regionally depending on local energy use and supply chains.
Table of Contents
- A quick data snapshot: CPI, PCE, and what consumers actually paid
- What's driving price moves right now
- Category snapshots: food, household supplies, energy, and building materials
- Practical steps U.S. shoppers can use this week and month
- Policy signals and what to watch next
- Historical price trend analysis over multiple years to provide context
- Regional variations in household essentials price trends
- Impact of seasonal factors on price fluctuations
- Forecasts or projections of future price trends
- Influence of government policies or stimulus measures on household essentials pricing
- How to read these trends for your household
- How OutletPicks helps you act on these trends
- Sources
- FAQ
A quick data snapshot: CPI, PCE, and what consumers actually paid
The government numbers and the numbers shoppers actually experience tell related but distinct stories this year. Both matter, and neither one alone gives you the full picture of what's happening to household budgets.
- The BEA's July 2026 personal income and outlays report put the personal saving rate at 3.0%, with real personal consumption expenditures up less than 0.1% for the month and the PCE price index up 3.7% year over year.
- BLS CPI data for August 2026 showed the CPI-U rising 0.4% for the month, with the food index up 2.7% year over year and the energy index up a sharp 16.3% year over year.
- Numerator's CGPI reading for August 2026 showed consumer-paid prices actually down 0.1% for the month, up 2.2% year over year, with a cumulative increase of 33.2% since January 2018.
The gap between these figures is the point. PCE and CPI are broad, government-calculated baskets. Numerator's index tracks what real households paid at checkout, and it shows low-income and Gen Z shoppers absorbing a larger share of that long-run increase than other groups. Headline inflation cooling doesn't mean every receipt looks the same.
What's driving price moves right now
Several forces are pulling household costs in different directions at once, which is why the headline number and your grocery receipt rarely agree.
- Energy and fuel costs ripple through nearly everything: when gas or electricity prices jump, trucking, refrigeration, and manufacturing costs follow, and the BLS energy index rose 16.3% year over year in August 2026.
- Supply-chain friction, from port congestion to freight disruptions, can create sudden regional shortages that spike prices on specific items even when national averages look calm.
- Building-material costs and tariffs on imports add pressure from the input side, and NAHB reporting shows these costs accelerating since 2024 with continued volatility.
- Retailers tend to raise prices quickly when their own costs rise but are slower to cut prices when costs fall, an asymmetry that keeps consumer prices sticky even after wholesale costs ease.
Pro Tip: Track a short list of items you buy weekly rather than watching the headline CPI number: it reacts faster to real supply shocks than a national average ever will.
Category snapshots: food, household supplies, energy, and building materials
Not every household category is moving the same direction, and the differences matter more than the average.
Food at home is the category most people watch closest, and it's also the most uneven. The USDA Economic Research Service's Food Price Outlook forecasts food-at-home prices up 2.5% in 2026, but that average hides real swings: fresh vegetables and fruits have seen notable month-to-month volatility, while other subcategories have stayed flatter.
- Eggs, beverages, and fresh produce are the subcategories most prone to short-term price swings tied to weather, disease outbreaks, or transport disruptions.
- Household supplies, including paper goods and cleaners, move more slowly but still show up in the BLS housekeeping-supplies index as a steady contributor to the broader CPI basket.
- Energy volatility doesn't stay in the gas tank: it feeds directly into grocery transport costs and utility bills, both of which show up on household budgets within weeks.
- Building materials remain the most jarring case. A September 2026 commodity report found that while the aggregate index looked flat, OSB prices rose about 10% and Southern Pine 2x4 lumber rose roughly 16% in the same window.
That last point is worth sitting with. A flat-looking index can hide double-digit swings in specific products, which is exactly why category-level tracking beats trusting a single aggregate number, whether you're pricing groceries or planning a home repair.
Practical steps U.S. shoppers can use this week and month
Data is only useful if it changes what you buy. Here's a sequence that works whether you're managing a weekly grocery run or a bigger household purchase.
- Reprice your actual shopping list by unit cost rather than sticker price. A larger package isn't automatically cheaper per ounce, diaper, or roll.
- Time non-urgent purchases around known seasonal dips, and check resources like OutletPicks' cheapest month to buy study before stocking up.
- Compare pack sizes, try private label on staples, and don't assume loyalty to one retailer or brand saves money without checking.
- Build a small buffer into your monthly budget for volatile categories like eggs or energy, and set a personal rule for when a price drop justifies stocking up.
- Use tools built for this: a cost-per-unit index across categories or a priced checklist can turn a vague sense of "prices are up" into a specific per-item comparison.
Pro Tip: Keep a running list of your five most-bought household items and check their unit price monthly. That habit catches price creep faster than any news headline will.
Policy signals and what to watch next
Two federal releases drive most of what shows up in your monthly budget, and they answer different questions. The BLS CPI report tracks what things cost; the BEA's PCE report tracks what people actually spend and save, which is why the two sometimes diverge.
- Watch energy and commodity prices closely: a freight or fuel spike tends to show up in grocery and transportation costs within a few weeks.
- Watch for port or shipping disruptions, which can create fast, localized price jumps even when national trends look calm.
- If energy or freight costs spike again, expect food-at-home and building-material prices to follow with a lag of a month or two.
- If supply chains continue to normalize, expect the gap between headline CPI and consumer-paid indexes like Numerator's CGPI to narrow.
A simple monitoring habit: check the BLS CPI release monthly, the BEA PCE report monthly, and skim a consumer-paid index like Numerator's CGPI for a reality check against the headline number.
Historical price trend analysis over multiple years to provide context
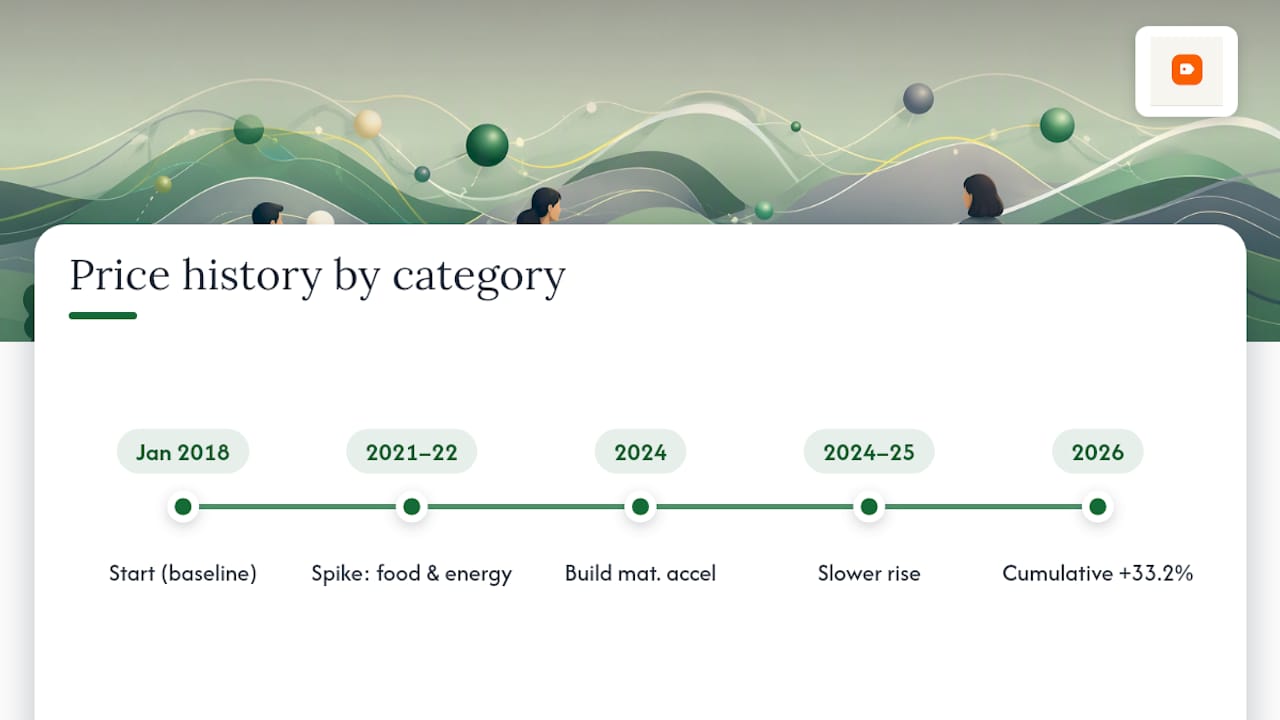
The 2026 numbers make more sense against a longer backdrop. Numerator's CGPI data shows a cumulative increase of 33.2% in consumer-paid prices since January 2018, a run that includes the sharp inflation spike of 2021 and 2022, followed by a slower cooling period through 2024 and 2025. That long climb is the backdrop against which "cooling" in 2026 has to be read: prices aren't falling in most categories, they're simply rising more slowly than they were a few years ago.
The pattern within that run has never been uniform. Energy and food prices spiked hardest and earliest during the initial inflation surge, while categories like household supplies moved more gradually. Building materials followed their own cycle entirely, with NAHB tracking showing input costs accelerating again since 2024 after an earlier period of relative calm, driven by separate supply and tariff pressures rather than the same forces pushing grocery prices.
What this history suggests is that "average" inflation figures smooth over a series of category-specific shocks rather than describing a single, steady climb. A household that only watches the headline CPI number risks missing exactly when their own most-purchased items are having their worst year. The more useful lens is tracking your own basket's trajectory over a few years, not just the last month's headline release, since the categories that spiked first in 2021 and 2022 aren't always the ones driving costs now.
Regional variations in household essentials price trends
National averages flatten real differences between what households pay in different parts of the country. Energy costs are a clear example: regions more dependent on heating oil or natural gas for winter heat feel energy price swings differently than regions where electricity dominates, and the BLS energy index's 16.3% annual jump lands unevenly depending on local fuel mix.
Freight and logistics costs compound this. Areas farther from major ports or distribution hubs tend to feel supply-chain disruptions more acutely and for longer, since goods have to travel farther through an already strained system. A regional trucking shortage or a port slowdown on one coast can raise prices in that area weeks before, or without ever, showing up nationally.
Building materials show similar regional patterns. Lumber and OSB price swings, like the roughly 10% and 16% moves noted in recent commodity reporting, hit hardest in regions with active homebuilding markets, since local demand for those materials amplifies national supply pressure. A household budgeting for repairs in a fast-growing region should expect more volatility than the national average implies.
The practical takeaway is that a national CPI or PCE figure is a starting point, not a forecast for your zip code. Local retailer pricing, regional energy mix, and proximity to distribution networks all shift how a national trend actually lands on a specific household's budget.
Impact of seasonal factors on price fluctuations
Household essentials don't move in a straight line through the year: they follow predictable seasonal rhythms layered on top of the broader inflation trend. Fresh produce is the clearest case, with prices for items like vegetables and fruit swinging with harvest cycles, weather events, and transport conditions, exactly the kind of volatility the USDA ERS Food Price Outlook flags within its 2026 forecast.
Energy prices carry their own seasonal pattern, typically climbing during peak summer cooling and winter heating months, which then pushes up transportation and grocery distribution costs with a short lag. That's part of why the energy index can swing sharply within a single year even when the broader CPI trend looks stable.
Building materials see seasonal demand tied to the construction calendar, with spring and summer typically bringing higher demand for lumber and other inputs as building activity picks up. That seasonal demand layer sits on top of the supply-driven volatility already showing up in materials like OSB and Southern Pine lumber.
For shoppers, the practical use of this pattern is timing. Non-perishable household essentials and even some seasonal goods tend to have predictable cheaper windows, which is the logic behind resources like OutletPicks' cheapest month to buy study. Knowing that a category has a seasonal low doesn't eliminate price risk, but it does let a household time discretionary purchases to avoid the seasonal peak.
Forecasts or projections of future price trends
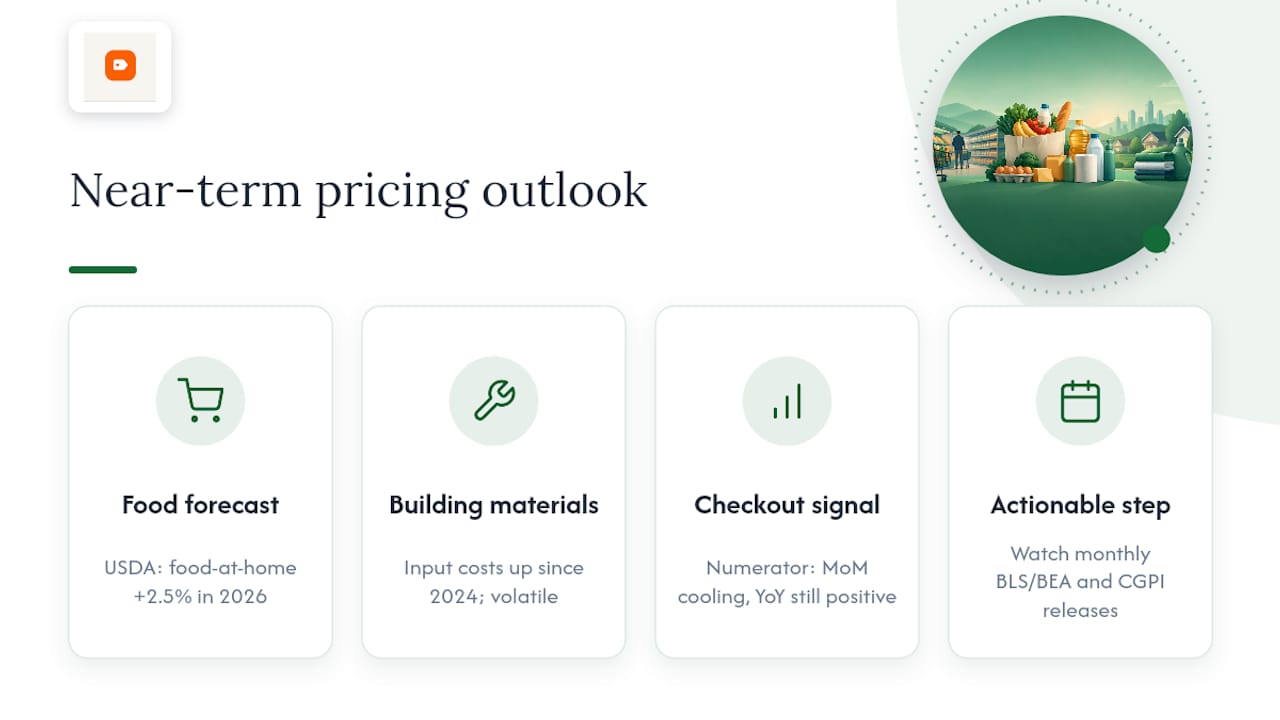
The most concrete near-term forecast available comes from the USDA ERS, which projects food-at-home prices rising 2.5% in 2026, with wide variation expected across subcategories rather than a uniform increase. That forecast pattern, moderate on average but uneven underneath, is consistent with what both the BLS and Numerator data show happening in real time.
Building materials carry more uncertainty. NAHB's tracking shows input costs that have accelerated since 2024 and remain volatile, with energy-related inputs often moving faster and more sharply than other material costs. That volatility makes precise forecasting harder in this category than in food, where seasonal patterns are better understood.
The broader signal from Numerator's data, a deceleration in month-over-month consumer-paid prices alongside a slower but still positive year-over-year increase, suggests the cooling trend visible in headline government data is also showing up at checkout, even if unevenly. Whether that continues depends heavily on the energy and freight conditions discussed earlier: a fuel or shipping shock could reverse the deceleration quickly, while continued supply-chain normalization would likely extend it.
The honest takeaway is that no single number captures where household essentials pricing goes next. The most reliable approach for a household isn't waiting for a definitive forecast, it's watching the monthly BLS and BEA releases alongside a consumer-paid measure like the CGPI, and adjusting spending as the categories that matter most to that household shift.
Influence of government policies or stimulus measures on household essentials pricing
Government policy shapes household prices through several channels, and tariffs on imported goods are among the most direct. NAHB's reporting points to tariff and trade policy as a contributor to the acceleration in building-material input costs since 2024, a pressure that flows into home repair and construction budgets even for households not actively building.
Monetary and fiscal policy work more indirectly but still matter. The BEA's PCE price index, which rose 3.7% year over year as of July 2026, is a key input the Federal Reserve watches when setting interest rate policy, and that policy in turn affects borrowing costs, business investment, and ultimately the pace at which retailers pass cost changes on to consumers.
Direct stimulus measures, of the kind seen during the earlier pandemic years, aren't a major feature of the current 2026 landscape, but their legacy still shows up in the data. Part of the 33.2% cumulative increase in consumer-paid prices Numerator tracks since January 2018 reflects that earlier stimulus-driven demand surge working its way through the system over several years.
For households, the practical implication is that policy changes rarely hit a grocery bill the next morning. Tariff announcements, interest rate decisions, and trade policy shifts tend to show up in household budgets with a lag of weeks to months, which is one more reason a single month's price move shouldn't be read as a permanent trend without checking the following month's data too.
How to read these trends for your household
The data this year rewards skepticism toward both good and bad headlines. Cooling inflation numbers are real, but they average away categories like energy and building materials that are still swinging hard in either direction depending on the month.
The most useful habit isn't tracking CPI or PCE religiously. It's checking the actual unit cost of the handful of items your household buys most often, since that's where national averages consistently mislead individual budgets.
— Alex
How OutletPicks helps you act on these trends
Watching CPI and PCE releases tells you the direction prices are moving; it doesn't tell you which brand or pack size actually saves you money this week. OutletPicks compares real cost per unit across retailers including Amazon and partners, so you can reprice your list by what things actually cost per ounce, per diaper, or per roll, not by sticker price.
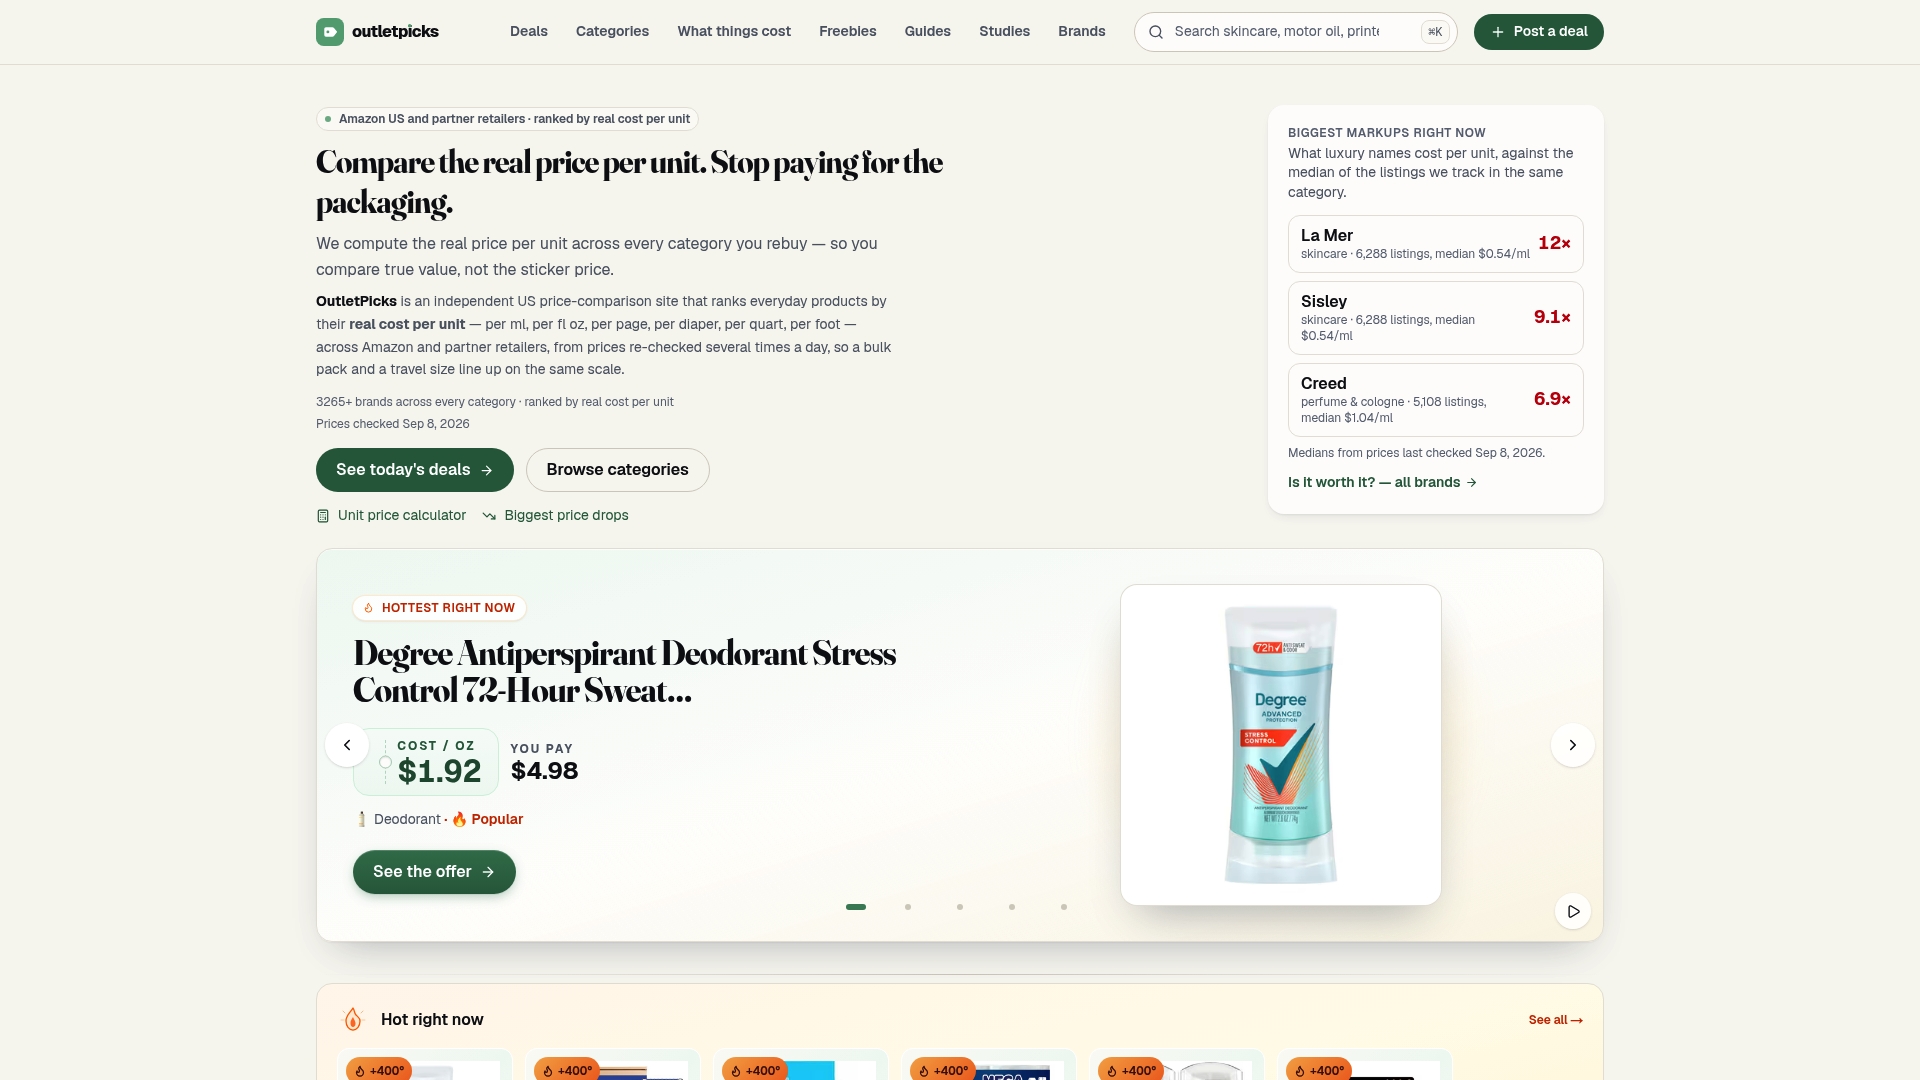
- Browse category comparisons for skincare, hair care, fragrance, and more to see unit-price rankings side by side.
- Check the live price drops page to catch category-specific dips before you restock.
- Use OutletPicks' cost-per-unit data alongside independent comparison tools like FactRated when you want a second, objective read on a specific product.
Start with your most-bought household items on the Live Price Drops by Category page and see what's actually worth buying now.
Sources
- Personal income and outlays, July 2026 — BEA
- Consumer Price Index — BLS (August 2026 release)
- Numerator Consumer Goods Price Index: Inflation decelerating — Numerator (Aug 2026)
- Food Price Outlook — USDA ERS
- Material costs affect housing affordability — NAHB
FAQ
What is a realistic grocery budget for a family of 3 in 2026?
A realistic budget depends heavily on location and shopping habits, and no single national figure fits every household. The USDA ERS Food Price Outlook forecasts food-at-home prices rising 2.5% in 2026, so a household's prior year spending adjusted by that rate is a reasonable starting point.
What is the average monthly grocery cost for Americans?
There is no single official monthly average figure that applies to all households, since spending varies by household size, region, and shopping habits. The BLS CPI food index shows food prices up 2.7% year over year as of August 2026, which is a better guide to the trend than any flat dollar figure.
What percentage of their income do Americans spend on food?
The specific share of income spent on food varies by household and isn't stated in the data anchors this article draws on, so a precise national figure would be a guess. What's clear from the BEA's personal income and outlays report is that overall spending growth has been modest, with real PCE up less than 0.1% for the month in July 2026.
Is it true that Americans are spending less on food?
Not exactly: Numerator's CGPI data shows consumer-paid prices dipped 0.1% in August 2026 compared to the prior month, but were still up 2.2% year over year. That's a slowdown in the pace of increases, not an actual decline in what most households are paying compared to a year ago.